


Content marketing in all its guises has one overall purpose – to drive people towards and then down your inbound marketing funnel.
But it must be remembered that quality content marketing goes beyond the blog. True, a regular, well-researched and well-written blog will form the cornerstone of your efforts – but in 2017 and beyond, content marketing is so much more than just blogging.
The types of content marketing range from whitepapers to eBooks, videos and infographics, content marketing should be embraced with an enthusiasm for richness and variety if that inbound marketing funnel is to remain lubricated and drive visitors towards its ultimate goal – sales.
But, first we must make sure that we have a strategy in place that will ensure as many people as possible enter the inbound marketing funnel in the first place. And well-produced infographics will form an integral part of that strategy.

The Power of Infographics
In today’s world of information overload – which, according to research, has rendered the human race with a shorter attention span than that of a goldfish – visual marketing is increasingly proving to be the solution to grabbing and holding audience attention.
Our brains process visual information 60,000 times faster than textual information, and so it is towards the visual that marketing has naturally evolved. Indeed, according to research cited in iamyourdesigner.co.uk, it takes the average person 60 seconds to read 200-250 words, but only one-tenth of a second to process a visual scene.

(Image source: iamyourdesigner.co.uk)
These are impressive figures that no business striving to get the most out of their content marketing efforts can possibly afford to ignore.
The visual appeal of infographics, combined with the fact that they make the consumption of large swathes of information nice and easy to digest, make infographics both highly clickable and highly shareable – precisely what’s needed to guide people towards your inbound marketing funnel.

(Image source: topmarketingschools.net)
These are impressive figures that no business striving to get the most out of their content marketing efforts can possibly afford to ignore. The visual appeal of infographics, combined with the fact that they make the consumption of large swathes of information nice and easy to digest, make infographics both highly clickable and highly shareable – precisely what’s needed to guide people towards your inbound marketing funnel.
5 Features of Infographics that Drive People to Your Inbound Marketing Funnel
1. Content Marketing that Stands Out from the Crowd
Content marketing guru Jeff Bullas has named infographics in his top 10 list of addictive content.
Addictive content. If you can start producing content that gets people hooked, then you’ll have no trouble at all pulling them towards your inbound marketing funnel (and of course, it is at the top of this funnel where infographics reside).
Part of the reason, no doubt, that infographics prove so addictive is because they stand out so brilliantly on social network feeds – which, of course, are already rammed full of content.
To put this in perspective, research from Micro Focus tells us that the amount of user content created EACH DAY on the internet amounts to the billions. This includes over 500 million tweets, 4 million hours of YouTube content and 4.3 billion Facebook posts. These figures are impressive – but they’re a little hard to digest when tucked away in a blog post like this.
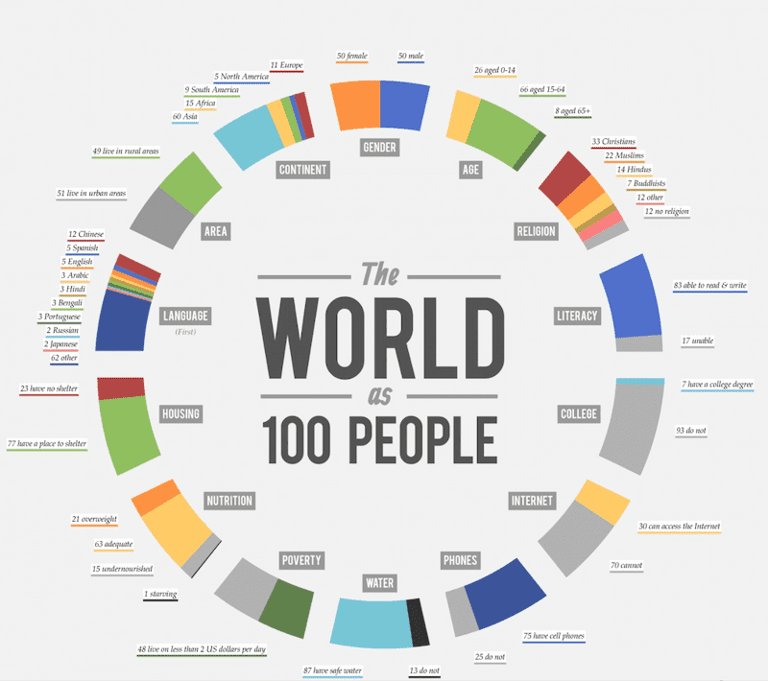
Fortunately, a brilliantly eye-catching infographic has been produced of the Data Never Sleeps 4.0 report that collates this information in a format that is a little easier to take in. Here it is…

(Image source: microfocus.com)
Thanks to the above infographic, we can now much more clearly appreciate the incredible amount of content that gets produced for the web every single day.
The problem, then, for your business is in making sure that the content that you produce gets noticed. And here’s where the benefit of infographics comes in. Just look at the example above, for instance. Infographics are beautiful, visually compelling and engaging pieces of content. They stand out in busy news feeds much more than simple blog headlines do, and on visual networks like Pinterest and Instagram, the thumbnails provide little nuggets of huge interest that just demand to be shared.
2. Putting Chaotic Information in Order
Infographics, of course, are all about data.
Data – facts, figures, statistics, graphs, charts – is often cluttered and hard to digest. But this data that you’ve collected is crucial to your business messages – it proves the value of what you are doing.
The trick, then, is to present this data in a simplified, memorable fashion – and that is what an infographic does with absolute brilliance.
Consider this insight from Lifelearn – when people hear information, they're likely to remember only 10% of that information three days later. However, if a relevant image is paired with that same information, people retained 65% of the information three days later.
This indeed goes a long way towards explaining why infographics are so addictive – they’re easy for the mind to process. If you want people to remember all the important statistics about your industry or your business, then put them into an infographic.
Here’s a great example from agricultural holding company Agroserv. Complicated data presented beautifully and memorably – exactly what infographics are supposed to do.

(Image source: visual.ly)
3. Great Infographics Improve Your Site’s SEO
The better your infographics, the more they will be liked and shared amongst the online community. Bloggers will be referring to them and building links in their content that point directly to your website where your infographic will be displayed – and backlinks, of course, are critical for SEO.
This will strengthen your domain, and indicate to Google’s algorithms that there is useful content on your site, which will help it rise through the rankings.
Here’s another example of a great-looking infographic that just cries out to be shared – this time from Animagraffs – and every time it does get shared, and every time someone links to it, the rankings of the host site improve. Below is a screenshot, but the actual infographic is animated – a rising trend today.

(Image source: animagraffs.com)
4. Easily Embedded and Portable
Infographics have the great characteristic of being supremely portable and very easily embeddable.
When you produce an infographic, you will also include an embed code that bloggers will then be able to use to embed your visual right there in their blog posts. With the infographic embedded, a link is automatically generated that leads straight back to your website, which will be in addition to any other attribution and backlinks that the blogger will naturally include for the use of your material.
This of course does wonders for your link portfolio, which in turn increases your domain authority (DA) and ensures that you are going in the right direction on Google’s rankings.
5. Easily Tailored to Target Audiences
Targeting and retargeting is super-important in modern digital marketing. Understanding what your users want is key to generating content that they will engage with.
Your infographic design is never set in stone, and can be very easily tailored to deliver information effectively to different user groups. If there is more than one facet to your business, then you will be trying to drive leads from more than one demographic. This means that not all of your business’s messages and information will be relevant to all of your following.
It’s very simple to make variations to infographics. Each one can be just slightly different, designed to only contain the key information that is relevant to each of your target audiences. Put simply, infographics are much more versatile and easier to manipulate in this way than your blog output will ever be. So, ring the changes, and let each infographic you create speak to different sets of users in ways that you know will engage them.
Here’s an example of an infographic that could be altered in all sorts of ways to incorporate all sorts of different data.
(Image source: thumbnails-visually.netdata-ssl.com)
Back to You
Infographics are a great medium for coaxing people towards and then down your inbound marketing funnel. They should form a part of your content marketing strategy as a matter of course, for the benefits are many. From improving your site’s SEO to making sure that your content marketing efforts stand out from the crowd, infographics are a crucial part of your inbound marketing funnel, and should never be overlooked.
Need help creating infographics? No problem. Get in touch with the inbound marketing experts here at Incisive Edge today.


